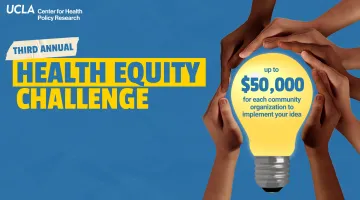
Health equity means that everyone — regardless of their background or circumstances — has a fair opportunity to reach their full health potential. The UCLA Center for Health Policy Research (CHPR) is committed to providing research and data on the health and health care needs of marginalized communities.
A person’s race, ethnicity, sexual orientation, gender identity, gender, age, citizenship status, English proficiency, disability, and socioeconomic status, as well as social determinants of health — the conditions in which people are born, grow, live, work, and age — impact access to and quality of care, and influence health outcomes. UCLA CHPR’s Health Equity Program helps policymakers, advocates, researchers, community leaders, media, and other key stakeholders understand where health gaps exist.
Led by Kathryn G. Kietzman, PhD, senior research scientist and Health Equity Program director, the Health Equity Program is recognized for its in-depth analysis, research, and technical assistance on the health issues and concerns of older adults, immigrants, sexual and gender minority groups, and racial and ethnic minority populations, such as American Indians and Alaska Natives.